Daily Market Review - 1/15/2014
US Stock Market

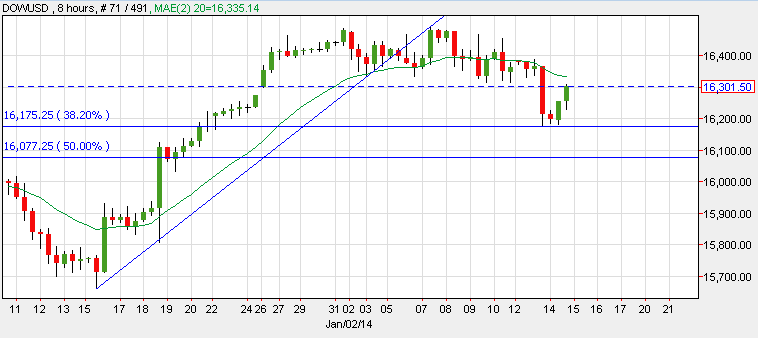
US indices finished the trading day with sharp gains as the Core Retail Sales m/m rose and the Financial Statements was published higher than forecast. The Dow Jones rose by 0.71%, the S&P500 by 1.08%, and the NASDAQ added 1.93% to its value. Technically, and according to the 8-hour chart, the Dow Jones hit the 38.20% Fibonacci Retracement but failed to breach it; a strong signal that the index will continue to rise and the momentum remain bullish. The support level is at 16,175 and maintaining this level could push the Dow higher towards 16,400. However, if the Dow Jones breaks this support level, it could continue its drop towards the 50% Fibonacci Retracement at 16,077.
Crude Oil - Long Term

For the last two years, the “almost zero” interest rate in markets pushed prices of many assets higher, especially the stocks markets. Crude Oil was left behind, a commodity that was one of the top recommended assets by investment managers. Last year, oil closed with a small loss of 0.6%. This means that, since 2011, the price of oil is struggling around the current price. Let’s look a quick look at the big picture and what are can expect this year for oil.
The positive forecast for global economic growth should have a positive impact on oil prices, with the demand for the black gold rising along with the price per barrel. On the other hand, discovery of new oil in the U.S will increase the supply of oil and this could bring the price down. Another reason for the drop in oil prices is Iran. An increase in Iranian all exports could also bring down the price. So on balance, it could well be that the price will drop, as the strong supply outweighs the positive global growth forecasts. One last factor is OPEC and U.S. oil companies. These share the same objective, and that is to keep energy prices higher. With all this in mind, it is our belief that oil could well trade this year around $100 a barrel, with both resistance and support hovering around $15 above or below this figure.
Crude Oil - Short Term
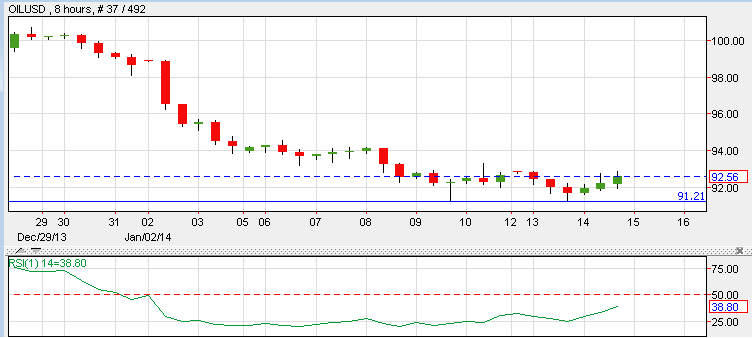
Crude Oil rose yesterday by 1.09% to close around the $92.65 mark due to the positive momentum in the stocks markets. According to 8-hour chart, oil has strong support at 91.20 and attempted to break this but failed. Oil might test this support again today before the inventories come out. If it fails to break support for a third time, this could open long positions that may send oil towards $98 a barrel in one week. The RSI indicator is at 38, indicating that oil is oversold; a factor that also supports short-term
Gold

Gold fell yesterday by 0.70% and closed around the $1,246 an ounce as the stocks markets rose. As you can see on the 1-hour chart, gold has two strong resistance levels. The first is at $1,246, and breaching this may lead gold towards its next resistance level at $1,255. Maintaining $1,246 could case a drop in the gold price to around $1,230. The moving average 50 is above the current candle which is also supporting the bearish trend; while the moving average 100 is keeping the price above $1,240. Should the Moving Average 50 cross below the Moving Average 100, then short positions are preferred.
EUR/USD

The Euro closed almost unchanged for the second day in a row despite the Industrial Production m/m coming out better than expected. Despite the US Dollar falling against most of the majors, the Euro remains weak. A technical analysis reveals that 1.3685 is proving a strong resistance level for the pair, and large positions are short at this price. Should the US Dollar continue to weaken against the other currencies, the EUR/USD may breach this resistance level and rise to around 1.3750. However, should the US Dollar gain versus the other majors, then we can short the EUR/USD to 1.3550. Today, the Trade Balance is expected at 16.7B vs. 14.5B previously.

Register For...
Free Trade Alerts
Education
1-on-1 Support
eToro Copytrader Tips