Daily Market Review - 1/23/2014
US Stock Market

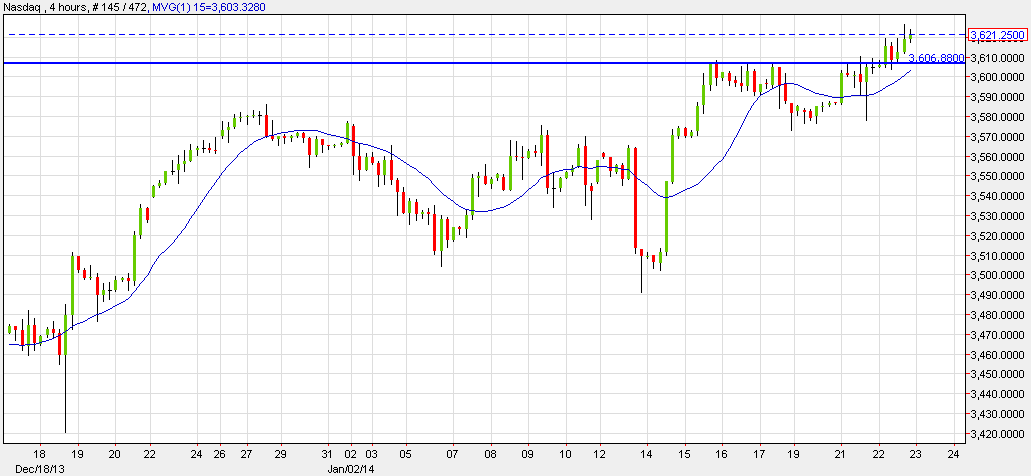
Wall Street finished Wednesday’s trading mixed after fourth quarter financial reports were published on Wall Street. The S&P 500 rose by 0.06%, the NASDAQ increased by 0.28%, and the Dow Jones lost 0.25% from its value. Technically, and according to the 4-hour chart, the NASDAQ index is trading at an all-time high. As long as the index holds above the support level of 3,606, the index may continue to rise to around 3,640. The Moving Average Indicator supports the bullish trend as well. Today, the Unemployment Claims report is expected at 331K forecast vs. 326K previously.
EUR/USD

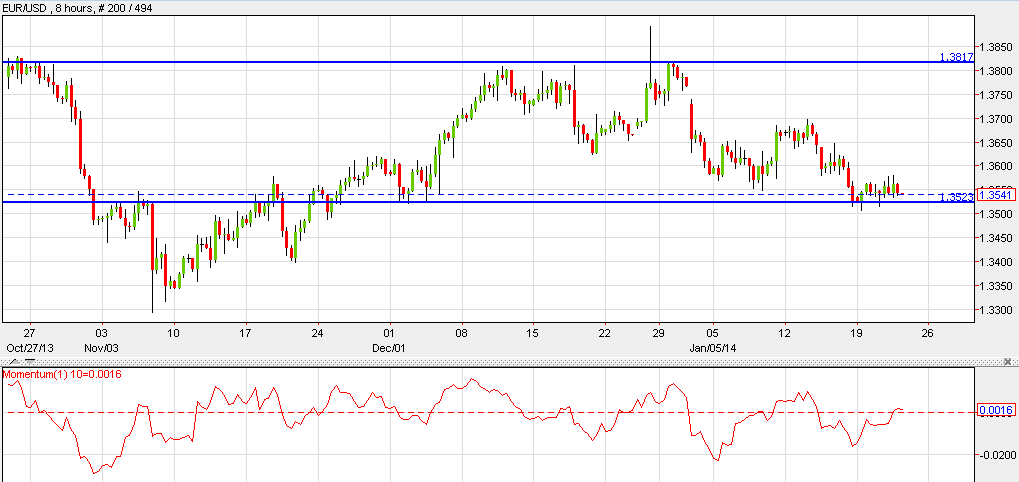
The euro rose versus the US Dollar yesterday after the Euro-zone debt level dropped for the first time in six years. Technically, and according to the 8-hour chart, the EUR/USD is holding above the support level of 1.3520 and is expected to rise to around 1.3700. Today, both German and French Flash Manufacturing PMI reports are expected to come out. High volatility is expected.
GBP/USD

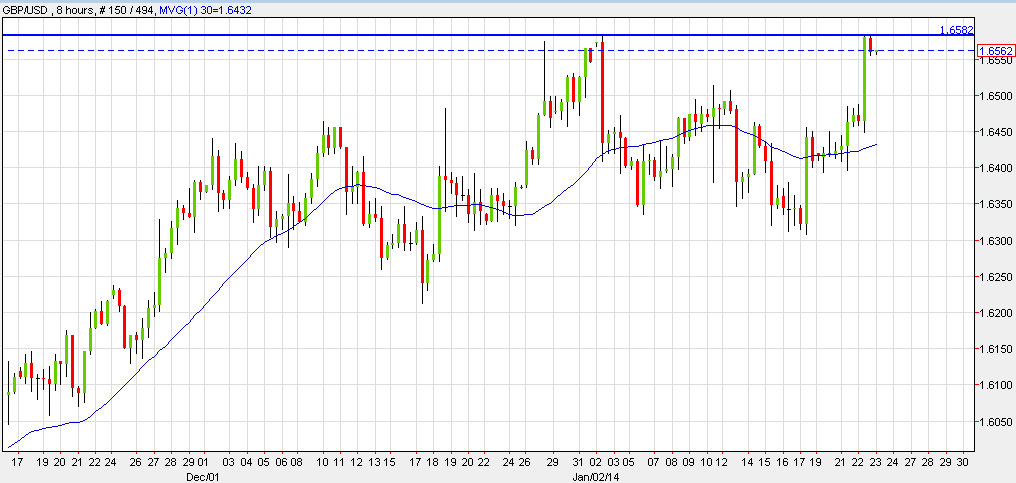
The Pound rose to its highest level in a year versus the US Dollar yesterday after the Unemployment Rate report came out better than expected at 7.1% vs. 7.3% forecast. Technically, and according to the 8-hour chart, the GBP/USD has touched the strong Double Top pattern resistance of 1.6585 and is struggling to breach this level. Should the pair succeed in crossing above this, it may continue to rise to around 1.6700. Today, the CBI Realized Sales report is due out at 28 forecast vs. 34 previously.
Crude Oil

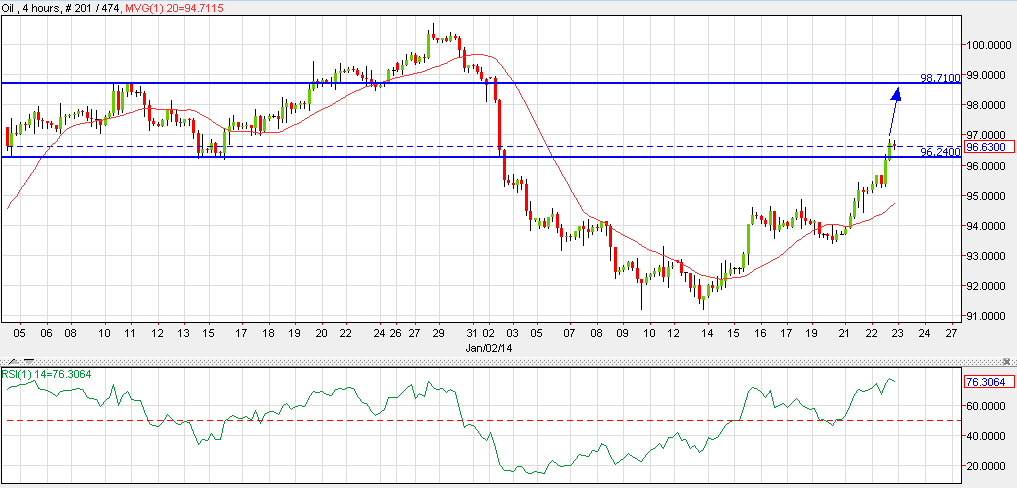
Crude Oil added 1.52% to its value, closing at $96.64 a barrel. Technically, and according to the 4-hour chart, oil has crossed above the resistance level of 96.24 and is expected to continue rising towards the next resistance level at 98.70. Both the RSI and Moving Average Indicators support the bullish trend as well. Today, the Crude Oil Inventories report is expected at 0.7M forecast vs. -7.7M previously.

Register For...
Free Trade Alerts
Education
1-on-1 Support
eToro Copytrader Tips