Daily Market Review - 1/28/2014
US Stock Market
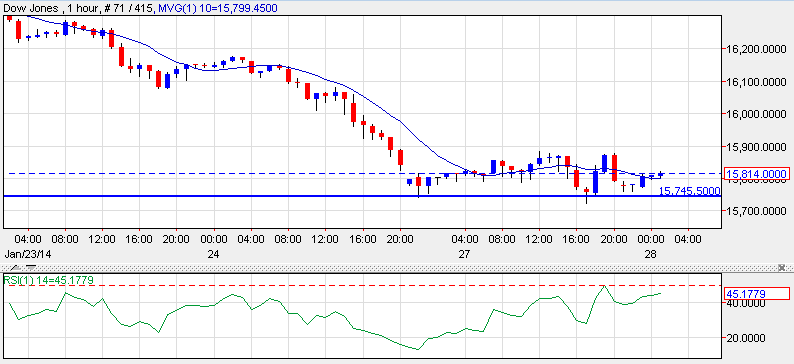
Wall Street finished the trading day in the red with the fear of the crisis in emerging markets and the continued reduction of quantitative easing affecting investment. The S&P 500 fell by 0.49%, the Dow Jones by 0.26%, and the NASDAQ lost 0.92% from its value. Technically, the Dow Jones has a strong support level at 15,745, which has created a double bottom pattern on the 1-hour chart. Should the index maintain this support, it may reach the resistance level of 15,900. The RSI indicator also supports the bullish trend.
Gold
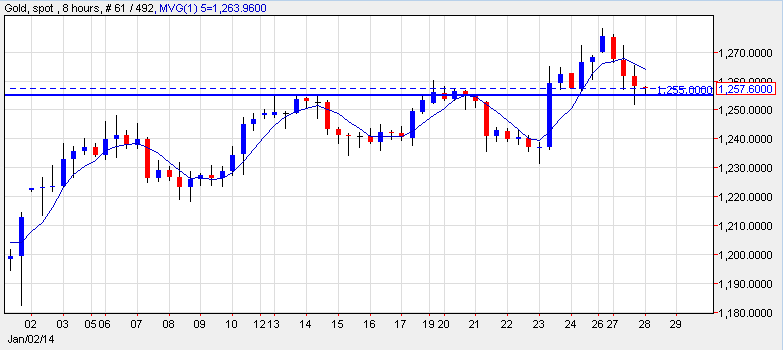
Gold dropped by 1.39% closing at $1,257 an ounce over expectations around the Federal Reserve lowering their monthly bonds purchases. Technically, and according to the 8-hour chart, gold is trading near the support level of $1,255. If the price breaks below this support level, it may fall to around $1,240. However, should it continue in the long-term ascending channel, it may reach $1,270 and above.
Euro (EUR)
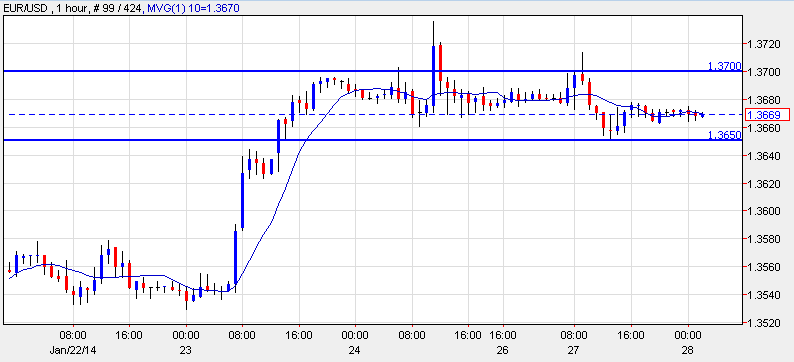
The euro fell slightly against the U.S Dollar. Technically, and according to the 1-hour chart, the EUR/USD is trading in a channel between the resistance level at 1.3700 and the support level at 1.3650. The pair has been trading like this for a week. Should the price cross below the support level, it may continue falling to around 1.3600. If it fails to do so and breaches the resistance level, it may rise to around 1.3750. Today, the ECOFIN meeting in Brussels may create some volatility in Euro-zone markets.
British Pound (GBP)
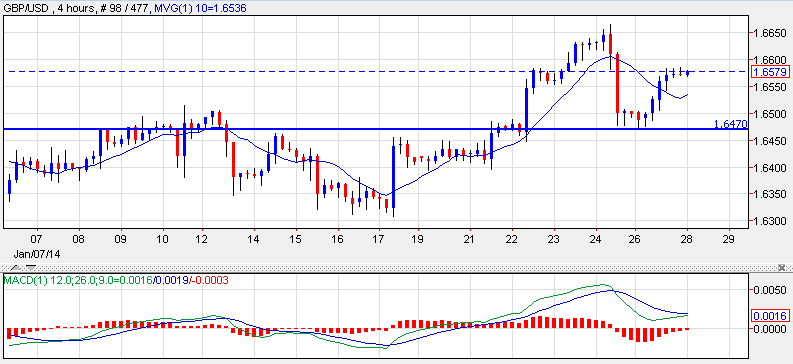
The Pound rose against the US Dollar. Technically, and according to the 4-hour chart, the GBP/USD moved towards the support level at 1.6470, but having failed to cross below it, began to rise towards 1.6580 areas. If the pair continues the positive momentum, it may reach 1.6650. The MACD indicator supports the bullish trend.
Economic Calendar
|
00:30 |
AUD |
NAB Business Confidence |
|
09:30 |
GBP |
GDP (QoQ) |
|
09:30 |
GBP |
GDP (YoY) |
|
13:30 |
USD |
Core Durable Goods Orders (MoM) |
|
13:30 |
USD |
Durable Goods Orders (MoM) |
|
14:00 |
USD |
S&P/CS HPI Composite - 20 (YoY) |


Register For...
Free Trade Alerts
Education
1-on-1 Support
eToro Copytrader Tips