Retracement or Reversal
Retracement or Reversal
Submitted by adil on Tue, 12/17/2013 - 13:33
Tagged as: Forex Trading , Forex Trading
Sometimes a pair tends to retrace and bounce backs in a major trend but these retracements occasionally convert into reversals. As a matter of fact, a temporary and small reversal in a prolonged trend is simply known as a retracement. This slight difference between the two often confuses even some of the most experienced traders in the business during a major trend.
There exist many important and significant differences between the two concepts and some of them are explained below.
Retracements and Reversals:
As mentioned above, a temporary reversal in a major trend is termed as a retracement. Retracements are actually short opposites of a major trend but not a reversal in a true sense. Traders can use many tools to measure them and one of the most important of these tools is the Fibonacci Retracement Levels. On the contrary, when a major trend moves in the opposite direction and is no longer valid, a major reversal is said to have occurred.
Differences between Formations of the Two:
The formation of reversal and retracement is also different to some extent. In this regard, it is always important to learn these differences and to know whether it is a retracement or reversal. These differences are briefly described below.
- Time Frame:
A retracement takes less than two weeks in the daily chart and therefore, takes a short time to form. On the other hand, reversal takes more than two weeks in the daily chart to occur.
- Chart Patterns:
Chart patterns for both retracements and reversals are totally different. For instance, reversal forms reverse chart patterns like double tops and double bottoms as well as head and shoulders whereas retracements form continuation chart patterns such as pennants and flags.
- Recent Price Movement:
Reversals mostly occur after a ranging condition but can also be found after a rapid price hike. On the contrary, retracements can only be observed after a major and rapid price hike.
- Candlesticks:
Reversals always create strong candlesticks patterns in the likes of soldiers and engulfing whereas candlesticks are neutral in nature and take the shape of spinning tops, bottoms and doji etc. during a retracement.
Determining the Scope of Retracement:
Alongside the differences between the reversal and retracements, it is also very imperative to identify the scope of retracements. Traders can easily do so after identifying the retracements in a major trend.
- The Trend Lines:
Trend lines can prove to be very useful in terms of identifying the scope of the retracements. The pull backs occur from these lines as they also serve as resistance and support for the retracements in the downtrend and uptrend respectively.
- Moving Averages:
Traders can also measure the scope of the retracements by employing the moving average technique as these averages works as the resistance and dynamic support. Most often, the retracements occur up to the resistance or dynamic support of the moving averages.
- Fibonacci Retracements:
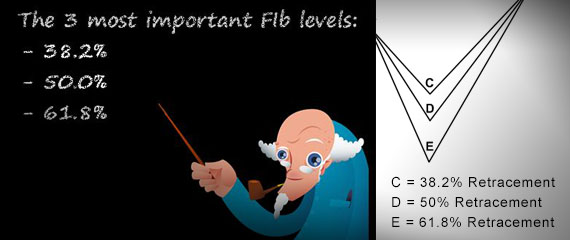
Fibonacci retracements are perhaps the most important tool to measure the scope of the retracements. Most often, retracements occur up to 38.2% to 50% but they can also form at level as high as 61.8%. Trend reversal occurs when these levels fail to indicate any retracement.
Conclusion:
It is very important for traders to know the difference between trade reversal and retracement. If a trader does not know these differences he might be trading in a losing position, trade false signals and most importantly, miss trading opportunities.

Register For...
Free Trade Alerts
Education
1-on-1 Support
eToro Copytrader Tips